
Gtmetrix Site Speed Analyzer assesses website performance and provides actionable insights to improve loading times. It offers detailed reports on speed, structure, and user experience.
Website speed is crucial for user satisfaction and search engine ranking. Slow-loading pages can drive users away and hurt your SEO efforts. Gtmetrix Site Speed Analyzer helps you identify performance bottlenecks and optimize your site. It evaluates various metrics like page load time, total page size, and the number of requests.
The tool also offers recommendations to enhance speed, such as compressing images, leveraging browser caching, and minimizing CSS and JavaScript. By following these suggestions, you can improve your website’s efficiency and user engagement, leading to better overall performance and higher search engine rankings.
Credit: kinsta.com
Introduction To Gtmetrix
Website speed is crucial for user experience and SEO. Slow sites frustrate users. They lead to higher bounce rates. Gtmetrix helps optimize site speed.
What Is Gtmetrix?
Gtmetrix is a tool that analyzes website speed. It provides detailed reports. These reports highlight performance issues. Gtmetrix uses Google Lighthouse and other tools.
The tool offers insights into load time. It shows how fast your site loads. It also provides suggestions for improvement. This helps webmasters enhance site performance.
Importance Of Site Speed
Site speed is critical for SEO. Search engines rank faster sites higher. Users prefer fast-loading sites. They are more likely to stay and engage.
A slow site can lead to lost visitors. They may leave before the site loads. This can decrease conversions. Fast sites improve user experience and retention.
Here are some key benefits of a fast site:
- Better search engine ranking
- Higher user engagement
- Increased conversion rates
- Lower bounce rates
| Metric | Impact |
|---|---|
| Load Time | Directly affects user experience |
| Page Size | Influences load time |
| Requests | Fewer requests lead to faster load times |
Key Features
Gtmetrix is a powerful tool for analyzing site speed. It offers many features to help improve your website’s performance. Let’s explore the key features of Gtmetrix.
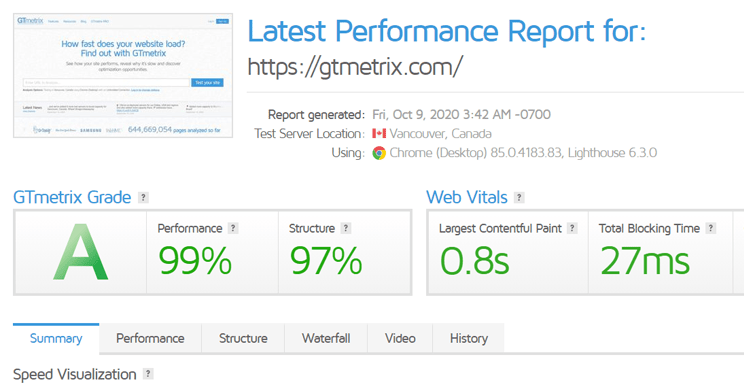
Performance Reports
Performance Reports give you a detailed insight into your site’s speed. These reports include scores, recommendations, and tips for optimization. The reports are easy to read and understand.
- PageSpeed Score: This score shows your site’s performance based on Google’s PageSpeed Insights.
- YSlow Score: This score is based on Yahoo’s rules for high-performance websites.
- Fully Loaded Time: This metric shows how long it takes for your site to fully load.
- Total Page Size: This shows the size of your webpage in MB or KB.
- Requests: This number shows how many requests are made to load your site.
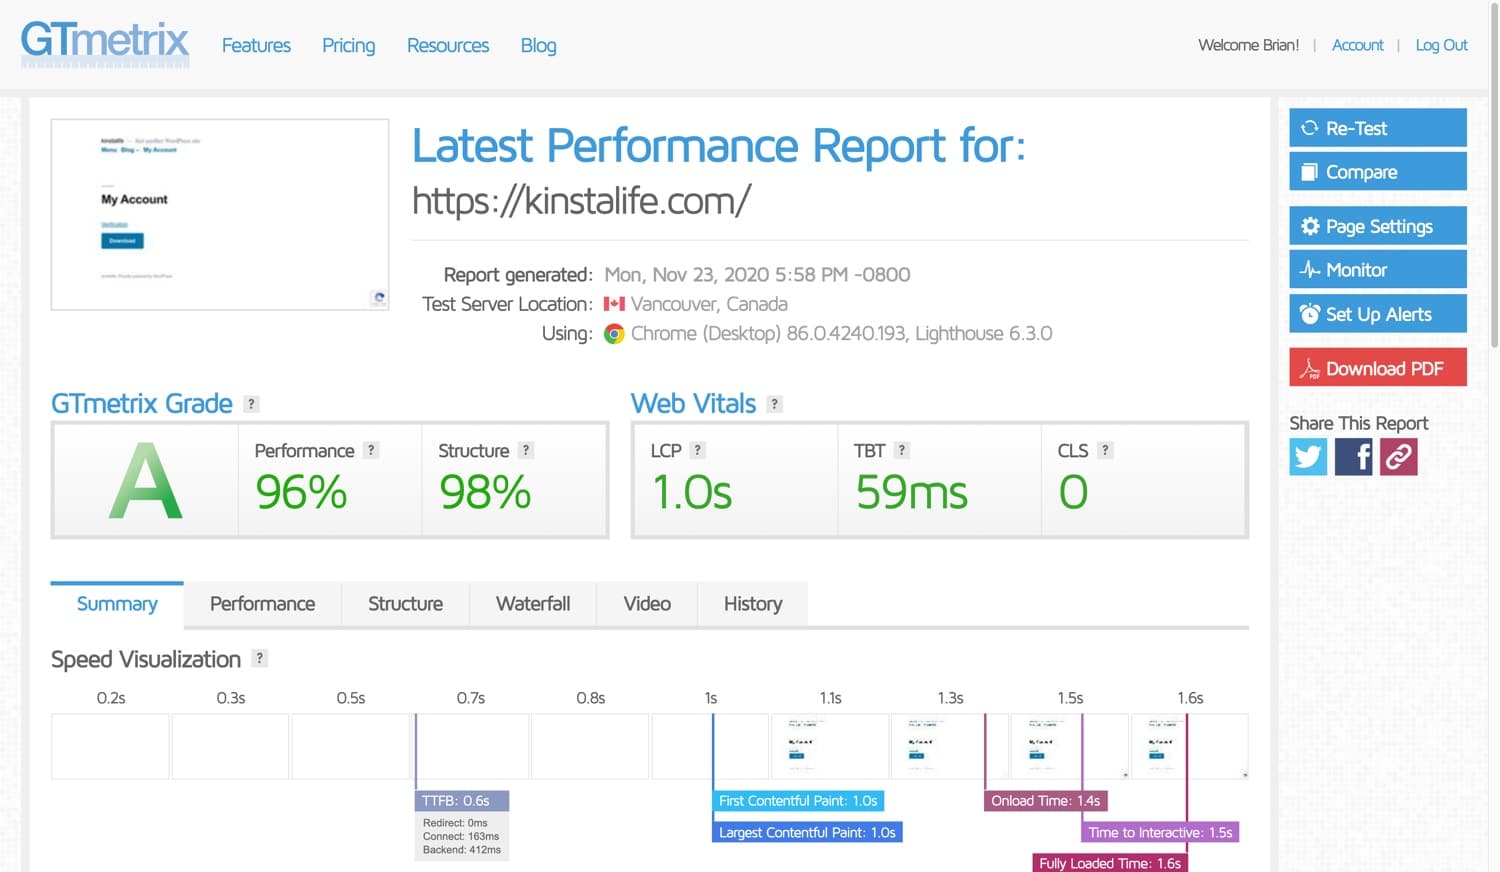
Waterfall Chart
The Waterfall Chart is a visual representation of your site’s loading process. It breaks down each element of your site and shows how long each takes to load. This helps identify bottlenecks and slow-loading elements.
| Element | Start Time | Duration |
|---|---|---|
| HTML Document | 0ms | 150ms |
| CSS Files | 150ms | 200ms |
| Images | 350ms | 400ms |
By analyzing the Waterfall Chart, you can see which files or requests slow down your site. This makes it easier to optimize and improve loading times.
Video Playback
The Video Playback feature lets you record your site’s loading process. You can watch a video of how your site loads in real-time. This helps you see any issues that might not appear in reports.
- Start the test to record the video.
- Watch the video to see each loading step.
- Identify and fix visual loading issues.
Using Video Playback, you can better understand user experience. It helps you pinpoint and fix loading problems that affect user satisfaction.
Setting Up Gtmetrix
Setting up Gtmetrix is essential for analyzing your website’s speed. This tool helps you identify issues that slow down your site. A faster website improves user experience and boosts search engine rankings. Follow these simple steps to set up your Gtmetrix account and add your website.
Creating An Account
First, visit the Gtmetrix website. Click the “Sign Up” button at the top right corner. Fill in your details such as email, username, and password.
After filling in the details, click the “Create Account” button. Check your email for a verification link. Click the link to verify your email address. Your Gtmetrix account is now ready.
Adding Your Website
Log in to your Gtmetrix account. You will see a dashboard with a “Test your site” box. Enter your website URL in this box. Click the “Analyze” button to start the test.
Gtmetrix will analyze your website and provide a detailed report. This report includes performance scores, page load time, and recommendations for improvement.
Table of Key Metrics
| Metric | Description |
|---|---|
| PageSpeed Score | Measures overall page speed |
| YSlow Score | Evaluates website performance |
| Fully Loaded Time | Time taken for the page to load |
| Total Page Size | Size of all elements on the page |
| Requests | Number of requests made by the page |
Use these metrics to identify areas for improvement. Make the necessary changes to boost your website’s speed. Regularly test your website with Gtmetrix to ensure optimal performance.

Credit: community.cloudflare.com
Analyzing Performance
Analyzing the performance of your website is crucial for user experience. The Gtmetrix Site Speed Analyzer helps you understand and improve your site’s speed. Let’s dive into the essential aspects of performance analysis.
Understanding Metrics
Metrics are key to analyzing site performance. Gtmetrix provides detailed metrics that show how your site performs.
- Page Load Time: Measures the time taken to load a page.
- Total Page Size: Indicates the size of the webpage in megabytes.
- Requests: Counts the number of requests made to load a page.
These metrics help you pinpoint issues affecting your site’s speed.
Evaluating Scores
Gtmetrix assigns performance scores to your website. These scores help you understand where your site stands.
| Score Type | Description |
|---|---|
| PageSpeed Score | Assesses the overall performance of your site. |
| YSlow Score | Evaluates your site against Yahoo’s rules for high performance websites. |
Higher scores indicate a better performing website.
Common Performance Issues
Understanding common performance issues is crucial for optimizing your website. The Gtmetrix Site Speed Analyzer helps identify these problems, making your site faster and more efficient.
Slow Load Times
One of the most critical performance issues is slow load times. Slow websites frustrate users and affect your SEO rankings. Gtmetrix provides a detailed breakdown of load times, showing where improvements are needed.
Several factors can cause slow load times:
- Unoptimized images
- Excessive HTTP requests
- JavaScript issues
- Server response time
Addressing these factors can significantly improve load times. For instance, compressing images reduces their size without losing quality. Minimizing HTTP requests by combining files also helps.
Large Page Sizes
Large page sizes are another common performance issue. A large page size increases the time it takes for a page to load. Gtmetrix can help identify large files that need to be optimized.
Typical culprits include:
- High-resolution images
- Uncompressed videos
- Bulky CSS and JavaScript files
Reducing page sizes involves several strategies:
- Compressing images and videos
- Minifying CSS and JavaScript files
- Using lazy loading for images and videos
Implementing these strategies can make a significant difference. A smaller page size ensures faster load times and a better user experience.
| Performance Issue | Solution |
|---|---|
| Slow Load Times | Compress images, minimize HTTP requests, optimize JavaScript |
| Large Page Sizes | Compress images/videos, minify CSS/JS, use lazy loading |
Using Gtmetrix to address these issues can transform your website’s performance. Faster load times and smaller page sizes result in happier users and better SEO.

Credit: gtmetrix.com
Optimization Techniques
Optimizing your website’s speed is crucial for better user experience. The Gtmetrix Site Speed Analyzer helps identify areas for improvement. Below, we explore key optimization techniques that can significantly enhance your site’s performance.
Image Compression
Large images can slow down your website. Compressing images reduces their size without compromising quality.
- Use tools like TinyPNG or ImageOptim for compression.
- Choose the right format: JPEG for photos, PNG for graphics.
- Set dimensions to fit the display area.
Optimized images load faster and improve user experience.
Minifying Css And Javascript
Minifying CSS and JavaScript files removes unnecessary characters. This includes spaces, comments, and line breaks.
Minified files reduce the amount of data transferred to the browser.
- Use tools like UglifyJS for JavaScript.
- CSSNano is great for minifying CSS.
Minification speeds up page load times. It also improves overall performance.
Implement these techniques using Gtmetrix recommendations. Your website will be faster and more efficient.
Tracking Progress
Tracking progress with the Gtmetrix Site Speed Analyzer is crucial for improving your website’s performance. Regular monitoring and setting performance goals help you keep your site running smoothly.
Regular Monitoring
Regular monitoring ensures your site stays fast. It helps you identify issues quickly.
- Schedule regular checks
- Use historical data to spot trends
- Keep an eye on key metrics like load time
Consistent monitoring allows you to react swiftly to any problems.
Setting Performance Goals
Setting performance goals gives you a clear target. It helps you measure improvement.
| Metric | Goal |
|---|---|
| Page Load Time | Under 3 seconds |
| First Contentful Paint | Under 1 second |
| Speed Index | Under 4 seconds |
Setting clear, attainable goals helps keep your site fast and reliable.
Advanced Tips
Advanced tips help optimize your website speed using Gtmetrix. These tips ensure your site loads faster and ranks better on search engines.
Leveraging Browser Caching
Browser caching saves website files on a user’s device. This reduces load times for returning visitors.
- Set Expiry Dates: Use the ‘Expires’ header to specify cache duration. Example:
Expires: Wed, 21 Oct 2023 07:28:00 GMT - Leverage Cache-Control: Use ‘Cache-Control’ to set caching policies. Example:
Cache-Control: public, max-age=31536000
Implementing A Cdn
A CDN (Content Delivery Network) distributes your site’s files globally. This improves load times by serving content from the closest server.
| CDN Provider | Features |
|---|---|
| Cloudflare | Free plan, DDoS protection, global network |
| Amazon CloudFront | Pay-as-you-go, highly scalable |
| KeyCDN | Easy integration, low latency |
Follow these steps to implement a CDN:
- Choose a CDN provider.
- Sign up and configure your account.
- Update your DNS settings to use the CDN.
- Test your website to ensure proper setup.
Frequently Asked Questions
What Is Gtmetrix?
Gtmetrix is a site speed analyzer that evaluates your website’s performance. It provides detailed insights and suggestions for improvement.
How Does Gtmetrix Work?
Gtmetrix analyzes your website by running various performance tests. It generates a report with scores, load times, and recommendations.
Why Use Gtmetrix For Site Speed?
Gtmetrix helps identify performance issues. It offers actionable insights to enhance user experience and improve search engine rankings.
What Are The Key Features Of Gtmetrix?
Gtmetrix offers detailed performance reports, waterfall charts, and video playback. It also provides recommendations for optimization.
Conclusion
Boost your website’s performance with the Gtmetrix Site Speed Analyzer. It’s an essential tool for optimizing site speed. Improve user experience and search rankings by analyzing and fixing speed issues. Stay ahead of competitors by ensuring your website loads quickly.
Start using Gtmetrix today to enhance your site’s efficiency.


