
Online Marketing Analytics involves analyzing data from online marketing activities to make informed business decisions. It helps businesses understand customer behavior and optimize marketing strategies.
Online Marketing Analytics is essential for any business aiming to succeed in the digital age. By tracking and measuring various metrics, businesses can gain valuable insights into their marketing performance. These insights help in understanding customer preferences, identifying trends, and optimizing campaigns for better results.
Tools like Google Analytics, social media analytics, and email marketing reports provide detailed data on user engagement, conversion rates, and ROI. Proper utilization of this data enables businesses to allocate resources efficiently, target the right audience, and ultimately, increase profitability. Embracing online marketing analytics is crucial for sustained growth and competitive advantage.
Introduction To Online Marketing Analytics
Understanding Online Marketing Analytics is crucial for success in today’s digital world. It helps businesses track their marketing efforts and make data-driven decisions. This blog post will guide you through the basics of online marketing analytics.
Importance Of Data
Data is the backbone of online marketing analytics. It provides insights into customer behavior and preferences. With data, marketers can:
- Measure campaign performance
- Identify target audiences
- Optimize marketing strategies
Without data, businesses would rely on guesswork. This can lead to wasted resources and missed opportunities. Thus, collecting and analyzing data is essential for effective marketing.
Evolution Of Analytics
Analytics has come a long way. In the past, marketers relied on basic metrics. Today, advanced tools and technologies provide deeper insights. Here is a table showing the evolution of analytics:
| Time Period | Analytics Tools | Capabilities |
|---|---|---|
| 1990s | Basic Web Analytics | Page views, Visits |
| 2000s | Google Analytics | Bounce rate, Session duration |
| 2010s | Advanced Analytics Tools | User behavior, Conversion tracking |
| 2020s | AI-Powered Analytics | Predictive analysis, Automated insights |
Today’s tools offer real-time data and actionable insights. This helps marketers make informed decisions quickly.
Key Metrics To Track
Understanding key metrics is vital for effective online marketing analytics. Tracking these metrics helps optimize strategies and improve performance. Below, we delve into the essential metrics to monitor.
Traffic Sources
Knowing where your website traffic comes from is crucial. Different sources can include:
- Organic Search
- Paid Ads
- Social Media
- Email Campaigns
- Direct Traffic
Use tools like Google Analytics to track these sources. The data helps you understand which channels drive the most visitors. You can then focus your efforts on high-performing channels.
Conversion Rates
Conversion rates show the percentage of visitors who complete a desired action. These actions can include:
- Purchases
- Sign-ups
- Downloads
- Form Submissions
To calculate conversion rates, use this formula:
Conversion Rate = (Number of Conversions / Total Visitors) 100High conversion rates indicate effective marketing strategies. Monitor these rates to identify areas for improvement. Use A/B testing to optimize landing pages and calls to action.
Tools And Platforms
Understanding online marketing analytics is crucial for any business. This section will explore the essential tools and platforms. These tools help you track and analyze your marketing performance.
Google Analytics
Google Analytics is one of the most popular analytics tools. It offers comprehensive data on website traffic. You can see where your visitors come from. It also shows what actions they take on your site.
Key features of Google Analytics:
- Track user behavior
- Analyze traffic sources
- Measure conversion rates
- Monitor real-time data
Using these features, businesses can make data-driven decisions. It’s a powerful tool to optimize your marketing strategies.
Social Media Insights
Social media platforms provide their own analytics tools. These tools help you understand your audience better. They offer insights into engagement, reach, and impressions.
Here are some important metrics:
| Metric | Description |
|---|---|
| Engagement | Measures likes, shares, and comments |
| Reach | Number of unique users who see your content |
| Impressions | Total views of your content |
These metrics help you understand which content works best. They also show how your audience interacts with your posts.
Each platform offers unique features. Facebook Insights, Twitter Analytics, and Instagram Insights are a few examples. Using these tools, you can refine your social media strategy.
Segmentation And Targeting
Online Marketing Analytics helps businesses understand their audience better. Segmentation and Targeting are key strategies. They allow marketers to divide their audience into groups. This way, they can tailor their messages effectively.
Customer Segmentation
Customer segmentation is the process of dividing customers into groups. These groups are based on common characteristics. Here are some common segmentation criteria:
- Demographic: Age, gender, income, education.
- Geographic: Location, climate, urban/rural.
- Psychographic: Lifestyle, values, interests.
- Behavioral: Purchase history, brand loyalty.
Using these criteria helps businesses understand their customers. They can create personalized marketing messages. This increases engagement and conversion rates.
Behavioral Targeting
Behavioral targeting is a technique used to deliver relevant ads. It is based on users’ past behaviors. This includes:
- Pages visited
- Time spent on site
- Items clicked
- Purchases made
Behavioral targeting can be very effective. It ensures ads are shown to the right people at the right time. This method can boost ad performance and ROI.
Here’s a table to summarize the differences:
| Aspect | Customer Segmentation | Behavioral Targeting |
|---|---|---|
| Basis | Demographics, Psychographics, Geography | User Behavior |
| Purpose | Group customers for personalized marketing | Deliver relevant ads based on behavior |
| Outcome | Increased engagement | Higher ad performance |
By combining both strategies, businesses can maximize their marketing efforts.
A/b Testing
A/B testing is a powerful tool in online marketing analytics. It helps businesses make data-driven decisions. By comparing two versions of a webpage or app, you can see which one performs better. This method boosts conversion rates and improves user experience.
Setting Up Tests
Begin by identifying the goal of your test. The goal could be increasing click-through rates or improving conversions. Next, create two versions of your element: Version A and Version B.
- Version A: This is your control version. It remains unchanged.
- Version B: This is the variant. It includes the changes you wish to test.
Use an A/B testing tool to split your audience. Tools like Google Optimize or Optimizely can help. Ensure each group is randomly selected and equal in size.
| Steps | Details |
|---|---|
| Identify Goal | Choose a specific objective |
| Create Versions | Design Version A and Version B |
| Split Audience | Use a tool to divide users |
Interpreting Results
After running the test, analyze the data. Look at key metrics like click-through rates, conversion rates, and bounce rates. Compare these metrics between Version A and Version B.
- Collect Data: Use your A/B testing tool to gather results.
- Analyze Metrics: Focus on important metrics.
- Determine Winner: Identify which version performed better.
Ensure the results are statistically significant. This means the results are not due to chance. Use tools like a statistical significance calculator to confirm.
Once you identify the better version, implement it. This ensures your marketing efforts are backed by data and optimized for success.

Credit: www.kunocreative.com
Data Visualization
Data visualization makes data easy to understand. It helps marketers make sense of numbers. Visuals can transform raw data into meaningful insights. This can boost marketing strategies significantly.
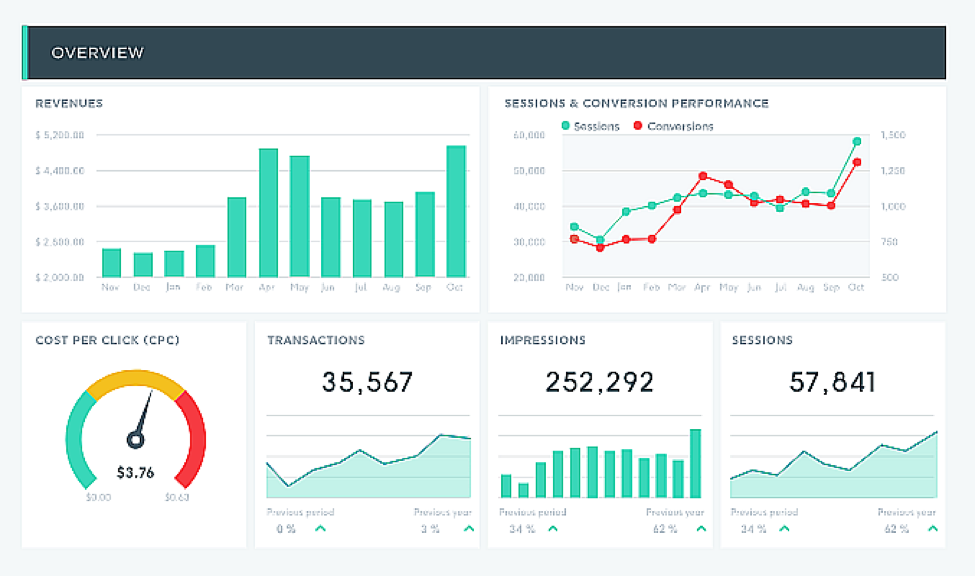
Dashboards And Reports
Dashboards provide a quick overview of key metrics. They are interactive and customizable. Users can track performance in real-time. Dashboards help in making quick decisions.
Reports, on the other hand, offer detailed analysis. They are usually generated periodically. These reports can highlight trends and patterns. Together, dashboards and reports offer a comprehensive view of data.
| Feature | Dashboards | Reports |
|---|---|---|
| Frequency | Real-time | Periodic |
| Detail Level | Summary | In-depth |
| Usage | Quick decisions | Detailed analysis |
Visualizing Trends
Visualizing trends helps in predicting future outcomes. Marketers can spot patterns over time. This can lead to better strategies. Trend lines, bar charts, and pie charts are commonly used. These visuals make complex data simple.
For example, a line chart can show sales growth. A bar chart can compare monthly performance. Pie charts can display market share. These visuals provide quick insights. They are essential for data-driven decision-making.
- Trend Lines: Show data changes over time.
- Bar Charts: Compare different categories.
- Pie Charts: Show parts of a whole.
Effective visualizations can transform your marketing efforts. They turn raw data into actionable insights.
Predictive Analytics
Predictive Analytics leverages historical data to make informed predictions about future outcomes. In online marketing, predictive analytics helps businesses anticipate customer behavior, optimize marketing strategies, and enhance overall performance. This section delves into two key aspects of predictive analytics: Forecasting Sales and Customer Lifetime Value.
Forecasting Sales
Forecasting sales involves predicting future sales volumes based on past data. Accurate sales forecasting helps businesses plan inventory, allocate resources, and set realistic targets. Predictive models use historical sales data, market trends, and seasonal patterns to generate forecasts.
Key benefits of sales forecasting:
- Inventory Management: Avoid stockouts and overstock.
- Resource Allocation: Optimize staffing and production schedules.
- Financial Planning: Set achievable financial goals.
A simple sales forecasting model could look like this:
sales_forecast = past_sales (1 + growth_rate)
Customer Lifetime Value
Customer Lifetime Value (CLV) is a predictive metric that estimates the total revenue a customer will generate throughout their relationship with a business. Understanding CLV helps businesses make informed decisions about marketing spend, customer acquisition, and retention strategies.
Key components of CLV:
- Average Purchase Value: Total revenue divided by total purchases.
- Purchase Frequency: Average number of purchases per customer.
- Customer Lifespan: Average duration of customer relationship.
A basic CLV formula:
CLV = (Average Purchase Value) (Purchase Frequency) (Customer Lifespan)
By leveraging these metrics, businesses can:
- Optimize Marketing Spend: Focus on high-value customers.
- Enhance Retention Strategies: Improve customer satisfaction.
- Increase Revenue: Boost customer engagement and loyalty.
Credit: bbs.binus.ac.id
Challenges And Solutions
Online marketing analytics is essential for understanding customer behavior and improving strategies. However, marketers face many challenges. Let’s explore some of these challenges and their solutions.
Data Privacy
Data privacy is a significant concern in online marketing. Ensuring customer data is protected is paramount.
- Challenge: Compliance with GDPR and other regulations.
- Solution: Implement robust encryption methods to protect data.
- Challenge: Gaining customer trust for data sharing.
- Solution: Be transparent about data usage policies.
Use secure servers and regularly update security protocols. Educate staff on data privacy best practices.
Handling Large Data Sets
Marketers often work with vast amounts of data. Managing this data efficiently is crucial.
- Challenge: Processing and analyzing large data sets.
- Solution: Use advanced analytics tools and software.
- Challenge: Storing massive amounts of data.
- Solution: Opt for cloud storage solutions.
Leverage machine learning to gain insights from data. Regularly clean and organize data to avoid clutter.
| Challenge | Solution |
|---|---|
| Data Privacy | Implement robust encryption, be transparent, use secure servers. |
| Handling Large Data Sets | Use advanced tools, opt for cloud storage, leverage machine learning. |
Future Of Marketing Analytics
The future of marketing analytics holds exciting changes. AI and machine learning are making data analysis smarter. New trends are emerging, changing how we see marketing. Let’s dive into these advancements.
Ai And Machine Learning
AI and machine learning are transforming marketing analytics. They help predict customer behavior and improve targeted marketing. Here are some key benefits:
- Better data insights
- Automation of repetitive tasks
- Enhanced personalization
These technologies can analyze vast amounts of data. They find patterns humans might miss. This leads to more accurate predictions and better marketing strategies.
Emerging Trends
New trends are shaping the future of marketing analytics. Here are some to watch:
| Trend | Description |
|---|---|
| Real-time Analytics | Get immediate insights from live data. |
| Customer Data Platforms (CDPs) | Centralize customer data for better insights. |
| Predictive Analytics | Foresee future trends and behaviors. |
Real-time analytics allow marketers to react quickly. CDPs provide a unified view of the customer. Predictive analytics helps in planning future campaigns.

Credit: matomo.org
Case Studies
Online marketing analytics help businesses understand their campaigns. Case studies show how different strategies work. They offer real-world examples of success and lessons. Let’s dive into some compelling case studies in online marketing analytics.
Successful Campaigns
Analyzing successful campaigns provides valuable insights. These examples show what works in online marketing.
| Company | Campaign | Key Metrics | Results |
|---|---|---|---|
| Company A | Email Marketing | Open Rate, Click-Through Rate | Increased Sales by 25% |
| Company B | Social Media Ads | Engagement, Conversion Rate | Gained 10,000 New Followers |
| Company C | SEO Optimization | Organic Traffic, Bounce Rate | Ranked Top 3 on Google |
Lessons Learned
Understanding what didn’t work is just as important. Lessons learned prevent repeating mistakes.
- Company A: Over-segmenting email lists reduced open rates.
- Company B: Ignoring mobile optimization led to low engagement.
- Company C: Keyword stuffing resulted in penalties.
These lessons highlight common pitfalls. Avoid these to succeed in online marketing analytics.
Frequently Asked Questions
What Is Online Marketing Analytics?
Online marketing analytics involves tracking and analyzing online marketing efforts. It helps businesses understand customer behavior and optimize campaigns.
Why Is Online Marketing Analytics Important?
Online marketing analytics is crucial for measuring campaign effectiveness. It helps identify areas for improvement and optimize marketing strategies.
How Do You Measure Online Marketing Success?
Success in online marketing is measured through key performance indicators (KPIs). These include metrics like conversion rates, click-through rates, and return on investment (ROI).
What Tools Are Best For Online Marketing Analytics?
Popular tools for online marketing analytics include Google Analytics, SEMrush, and HubSpot. These tools provide detailed insights into marketing performance.
Conclusion
Mastering online marketing analytics is essential for business success. It enables informed decisions and boosts your marketing strategy. By analyzing data, you can understand customer behavior and optimize campaigns. Invest time in learning analytics tools and stay ahead of the competition.
Your business growth depends on it. Start today.